A very personal view of Johan Nicolaas Herbschleb
3300-450 Secarias Portugal
Copyright 1992, 2025 J.N.Herbschleb
Email johan@herbschleb.net
I. INTRODUCTION
The fact that ventricular fibrillation can be considered as an electrical accident justified standard signal analysis on electrographs during ventricular fibrillation in dogs and patients under different circumstances in order to see whether in this description ventricular fibrillation would emerge as one syndrome or not.
Moreover it seemed fruitful to develop models – based upon accepted theories of cardiac anatomy and electrophysiology – that would describe ventricular fibrillation as emerging from this analysis.
II. THEORIES ABOUT VENTRICULAR FIBRILLATION
The existing theories about ventricular fibrillation and their associated models can be divided into two groups: those based upon the idea of a circus movement and those based upon ectopic foci. Both concepts present theoretical problems and their main drawback is that one either has to assume drastic changes in the physiology of the myocardial cell during ventricular fibrillation, or one has to make unrealistic assumptions about the start of ventricular fibrillation.
IV. SINGLE CHANNEL ANALYSIS
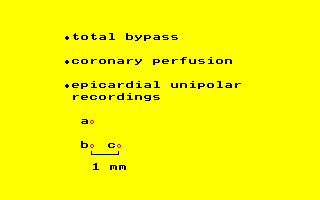
888 electro(cardio)grams during ventricular fibrillation in dogs with artificial coronary perfusion have been analyzed. Only 15% have Normally distributed amplitudes. The amplitude histograms are classified in this chapter as unimodal symmetrical, unimodal asymmetrical, rectangular or two-peaked.
The autocorrelation function damped to zero within 2 seconds in 53% of the cases.
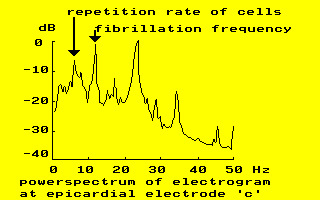
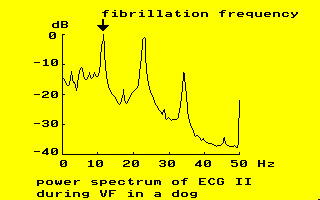
Most of the auto power spectra of electro(cardio)grams during ventricular fibrillation contain equidistant peaks. The basic frequency (defined as the highest peak in the power spectrum) of ventricular fibrillation ranges from 9 to 13 Hz in dogs. In approximately 25% of the spectra clear peaks were seen at half the basic frequency.
The autobicoherency indicated the higher frequencies as true harmonics of the basic fibrillation frequency.
V. A LOCAL, OSCILLATING MODEL
In this chapter two types of oscillating models are described. The first type of model has been based on the random neuronal networks and models from the field of epidemiology. These models are capable of sustained, rhythmic activity, but never faster than the basic rate of the elements.
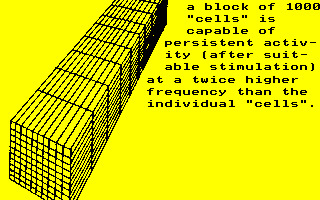
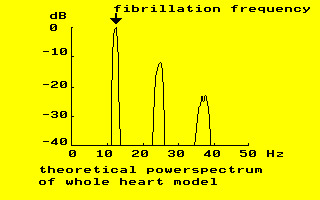
These models also were capable of sustained, periodical activity. The net result of this phenomenon was that the externally recorded activity showed a twice higher repetition frequency than the individual cells.
Several PC-programs have been constructed by me to illustrate these models. They were however made for an old operating system, so they are no longer available. Maybe later.
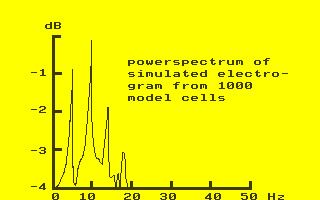
As the groups were not of the same size the power spectrum also contained small peaks at half the apparently basic frequency.
VI. CONCLUSION ABOUT LOCAL FIBRILLATION
In this chapter the spectra with very narrow, strongly bicoherent peaks are explained as resulting from a regularly repetitive phenomenon measured by the electrodes.
A broader basic peak associated with a breaking up of the higher harmonics in separate peaks points to a summation of signals with slightly different repetition frequencies. This class of signals will show in the time domain the characteristic amplitude pulsation of ventricular fibrillation.
A high irregularity in the repetition will somewhat broaden the basic peak in the auto power spectrum, but the diminishing of the higher harmonics is much more indicative of this type of signal.
VII. MULTI CHANNEL ANALYSIS
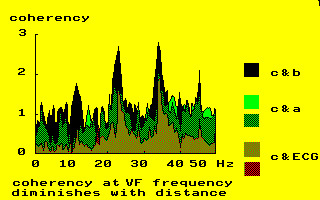
The coherency spectra between electrodes indicated coherent areas during ventricular fibrillation with a size range of smaller than 2 mm to larger than the electrode size. In those cases where several independent coherent areas were seen along the needle electrode, the borders between these areas were not due to anatomical features, but shifted in the course of time. The cross phase spectra were used to estimate time differences within coherent areas.
Illusion of travelling wavefronts
As expected the frequency analysis of ventricular fibrillation in dogs without coronary perfusion indicated a non-stationary signal, contrary to the results described in chapter IV. At the onset of fibrillation however the same type of spectrum was found as in the stable situation. The results of signal analysis of the ECG during ventricular fibrillation in patients are, apart from a lower fibrillation frequency, in accordance with the results from the experiments in dogs and the models as described in the previous chapters. The most striking conformity with the model developed in chapter V was shown in a coronary care patient, whose tachycardia developed into ventricular fibrillation with a frequency twice that of the tachycardia, while that lower frequency was still clearly distinguishable in the spectrum during ventricular fibrillation.
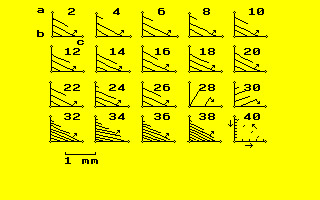
Assuming orderly, travelling wavefronts over small distances during ventricular fibrillation, 5 ms isochrones have been sketched between electrodes a, b and c at intervals of 2 s. The consequences of this assumption are
- low conduction velocities
- abrupt changes in these velocities and
- even circular movements as indicated.
No propagation of a wave front was found, as there was no linear dependence between the phase difference at the basic frequency and the phase differences at the higher harmonics. The change of the cross phase in course of time indicate how areas under adjacent electrodes can first oscillate with a frequency difference of approximately 0.01 Hz and than suddenly get synchronized. Typical behaviour for pseudowaves as defined by Arthur T. Winfree in ‘The Geometry of Biological Time’ 1980.
An explanation is given with the help of the models of the previous chapters.
VIII WEAKLY COUPLED RELAXATION OSCILLATORS
At the cellular level the behaviour of a model of small groups of strongly connected cells during ventricular fibrillation (chapter V) fulfils the formal requirements of relaxation oscillators, so the conclusions from literature about weakly coupled relaxation oscillators can be applied to ventricular fibrillation.
Important analogies between the observations and the literature found are: the slow movement of the borders between coherent areas, partial frequency entrainment rather than synchrony and consequently pseudowaves instead of conduction of the action potential.
IX. CONCLUSION ABOUT LARGE-SCALE FIBRILLATION
The dispersion in refractory period will lead to an apparent fibrillation frequency of 11 – 13 Hz if one assumes a mean repetition period of 6 Hz. The findings of chapter VII are strongly reminiscent of weakly coupled relaxation oscillators; anti-phase mode, partial entrainment, etc. Pseudowaves (or: optical illusions) are more likely than real, travelling waves during ventricular fibrillation.
Run a simulation with ‘VFsimul’.
X. FREQUENCY ANALYSIS OF THE ECG DURING VENTRICULAR FIBRILLATION WITHOUT ARTIFICIAL CORONARY PERFUSION
XI. MISCELLANEOUS EXPERIMENTS
Complete stop of coronary flow during ventricular fibrillation did alter the spectra considerably, but restoring the flow gave rise again of the same ventricular fibrillation. Ligation of the left ascending artery did not change the spectra significantly.
A tricyclic anti-depressant slowed ventricular fibrillation and brought ultimately the heart in asystole, which was followed by a sinus rhythm.
The transition from stimulated tachycardia into ventricular fibrillation confirmed the theory of this study, that ventricular fibrillation is a double tachycardia.
XII. MATHEMATICAL CONCLUSION
The Fractal
In a more or less anecdotal introduction the importance of awareness of theories and models is sketched. What is a relevant observation and what not? what is an erroneous result and what not? The answers to these questions depend upon one’s basic philosophy of science.
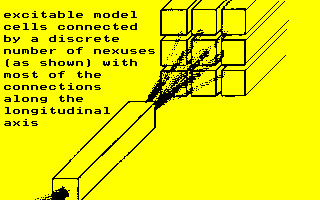
The ‘cells’ in the model are typical Lindenmayer-fractals, i.e. they have states and one state causes the next. Globally 3 types of state: active, unresponsive, responsive, If enough neighbours are in the active state, a cell in the responsive state becomes active.
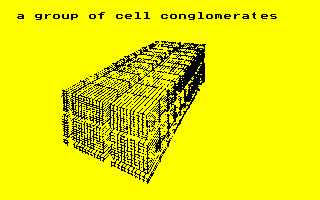
The second type consists of a three-dimensional array of 1000 interconnected cells with the number and kind of connections based upon data from literature.
The four levels of the model of ventricular fibrillation are described.
- 0: The myocardial cell: not treated in this study; considered unchanged during ventricular fibrillation.
- 1: A group of closely connected myocardial cells. This group can be described as a cellular automaton or as a fractal. At this level no chaos is possible.
- 2: Coupled, interacting level-1 clusters as weakly coupled relaxation oscillators. At this level chaos is possible, but has not been observed.
- 3: The whole ventricle is represented as a conglomerate of independent oscillators.The movie shows a model of human ventricle with a lot of little red lamps, that switch on and off at almost the same frequencies completely independent of each other. The fronts you may notice are pseudo-waves.
XIII SUMMARY
At last the whole study can be summarized in a few formulas.
The extra-cellulary recorded electrical signal from the heart during ventricular fibrillation can be described as:
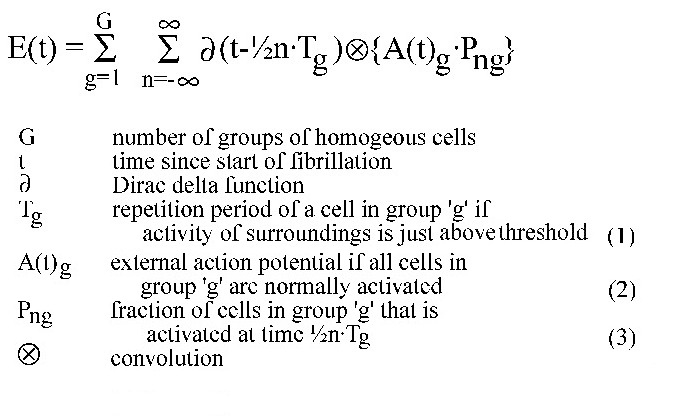
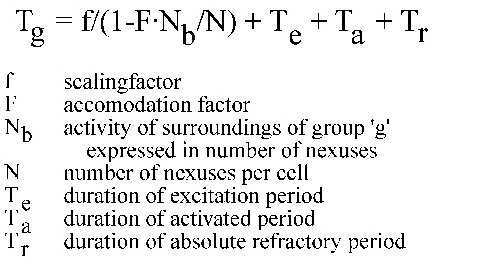
(1) Elaboration of function T
(2) Elaboration of function A(t)
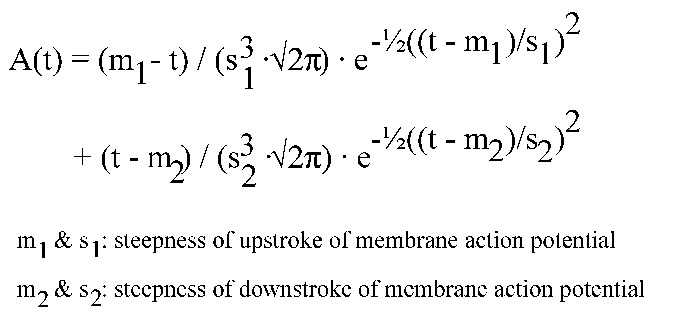
(3) Elaboration of function P
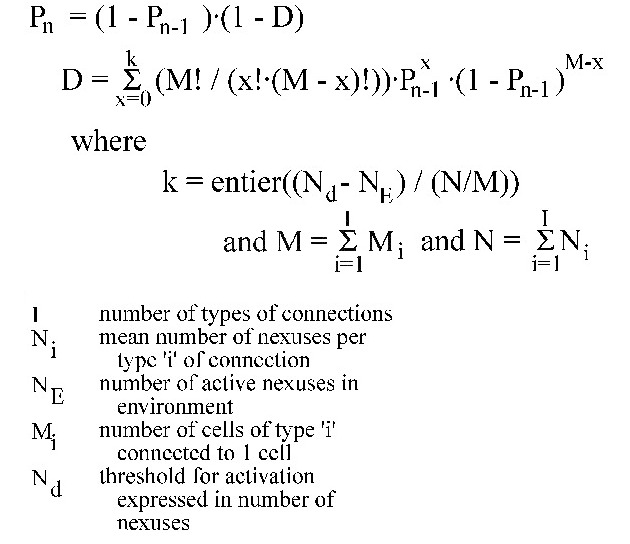
Remark # 1
The functions T, A(t) and P have the suffix ‘g’, because every group ‘g’ is supposed to have its own parameters.
Remark # 2
The form of the function E(t) is chosen to facilitate the mathematical insight. All frequency domain analysis in this book is based upon Fourier transforms. The Fourier transform of a train of Delta functions is again a train of Delta functions and the Fourier transform of the exponential function is well defined too. The Fourier transform of a convolution of functions is equal to the product of the Fourier transforms of these functions. Now the mathematically inclined reader can easily verify the strong resemblance between the calculated spectra from function E(t) and the estimated spectra from electrocardiograms during ventricular fibrillation, including the time domain phenomena like pseudo waves!
The functions E(t), T, A(t) and P can be visualized with the help of program Vf_simul.exe.
The program VFMODEL.EXE gives you the posssibility to change all parameters- The ones I used are saved in vfdef.par.
These programs were written for Ubuntu and compiled for Microsoft Windows in 2010. A part of the source is lost. Do not run them on a production system.
Unzip the downloaded file in a Windows system and run the programs in the same place as the pictures. They run very well in LINUX Wine environment.