1 Introduction
Frequency analysis of cardiac electrograms of dogs with artificially induced ventricular fibrillation during complete cardiopulmonary bypass and coronary perfusion indicated a great stability of the statistical properties of the signal over periods of several hours (chapter IV ).
Ventricular fibrillation is not anymore induced during open heart surgery, so the only available patient data for this study come from recordings on magnetic tape of ECG’s of patients with “spontaneous” ventricular fibrillation without coronary perfusion. The increasing hypoxia of the heart of these patients clearly does not form a sound basis for the assumption of stationarity of the analyzed signal. To form a link between the analysis of the stationary ventricular fibrillation in dogs with artificial coronary perfusion and the analysis of the essentially nonstationary ventricular fibrillation in patients, ventricular fibrillation was induced in two dogs without coronary perfusion and their ECG was analyzed.
The data for this part of the investigation were obtained by copying analog tapes containing recordings of standard ECG leads via conventional electrodes and ECG amplifiers. Signals of a sufficiently long duration became available of two dogs from the Laboratory of Experimental Cardiology of the University of Utrecht, 1 episode of ventricular fibrillation in a healthy human heart caused by an incident during catheterization in the University Hospital and of 20 episodes of ventricular fibrillation in 11 patients from the coronary care unit of the St. Antonius Hospital, Nieuwegein.
Fourier transforms were calculated according to the methods described in chapter III .
2 Ventricular fibrillation in a healthy human heart
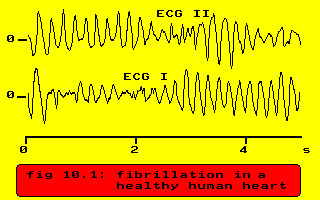
The case is ventricular fibrillation in a 60 year old man with aorta stenosis and an otherwise healthy heart. The fibrillation started during the introduction of a catheter in the right ventricle. The ECG during ventricular fibrillation is shown in the next figure.
Spectral analysis of VF in a healthy human heart
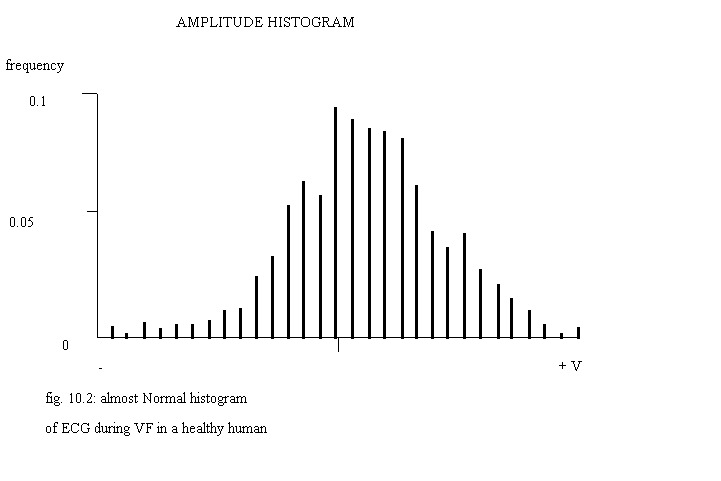
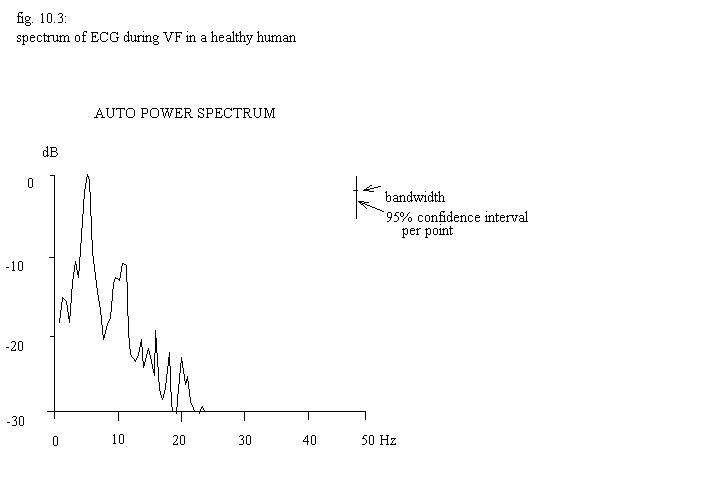
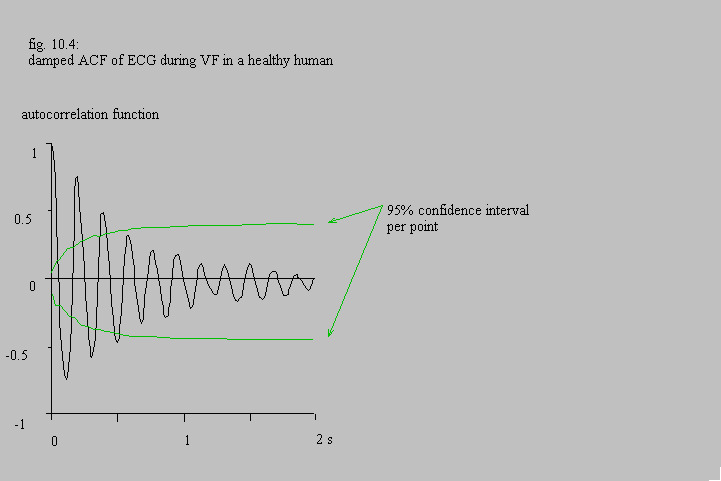
The histogram fig. 10.2 looks like that of Gaussian white noise, although normality has been rejected by the Kolmogorv-Smirnov test. The auto power spectrumin fig. 10.3 contains two rather broad peaks with a basic frequency of 5 Hz . The autocorrelation function in fig. 10.4 damps to zero within 1 second.
3 Dynamics of spectra
In cooperation with Annelien Roenhorst
3.1 Methods
In order to see what changes would occur in course of time, an estimation of the auto power spectrum was made by calculating a moving average over 10 consecutive blocks (20 seconds) of Fourier transforms. Using the DISSPLA graphics software package a pseudo three-dimensional impression of the moving average of the power spectrum was made. Contour lines of these three-dimensional images were drawn at 5 dB levels.
3.2 Analysis of dog data
The dynamics of the spectra in 2 healthy, intact dogs followed the same pattern: fast and fairly regular ventricular fibrillation in the first 10 seconds followed by a slowing down and an increasing irregularity, see the ECG of one of these dogs in the next figures.
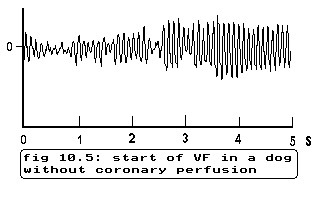
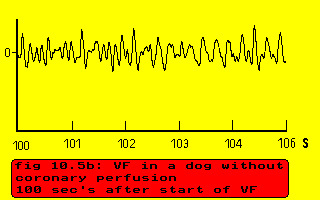
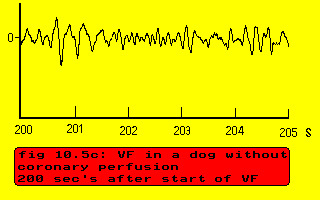
fig. 10.5: several instances of ECG of a dog during unassisted VF
In this dog the fibrillation starts with a basic frequency of 11 Hz and a higher harmonic of 22 Hz, then slows down to 4.5 Hz, remains rather stable and regular between 60 and 140 seconds after the onset of ventricular fibrillation as indicated by the clear higher harmonic around 9 Hz and becomes slower and more irregular after 150 seconds
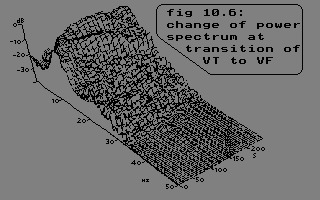
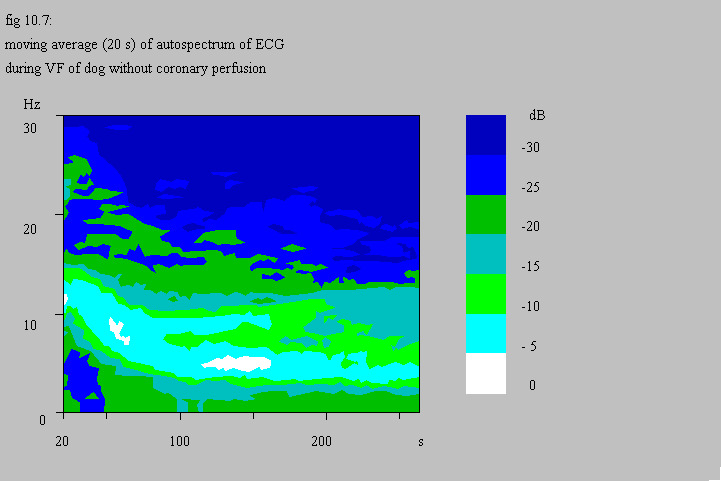
Especially the three-dimensional representation indicates clearly the decrease in amplitude of the higher harmonic.
Contrary to the experiments described in chapter IV , ventricular fibrillation under these circumstances cannot be considered as a stationary process.
3.3 Analysis of patient data
Up till now 20 occurrences of ventricular fibrillation in 11 coronary care patients became available for analysis. In general, if there is a sufficiently long period of ventricular fibrillation (> 20 sec’s), the power spectrum shows a peak at the basic frequency of fibrillation plus at least one higher harmonic. If the heart is fairly regularly beating, normally or in tachycardia the largest peak in the power spectrum corresponds to the mean heart rate (comparable to the mean R-R interval) and higher harmonics are present. In 10 cases the so-called fibrillation frequency was twice the frequency of the beating heart just before ventricular fibrillation; sometimes this frequency was seen as a subharmonic in the spectrum during ventricular fibrillation. Two examples of the analysis will be shown and commented upon; see table 10.1 for patient codes and summary of results.
- A2: The first example is ventricular flutter and ventricular fibrillation of 83 seconds duration, which arose after a premonitory tachycardia in a 50 year old woman.
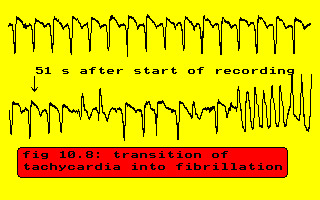
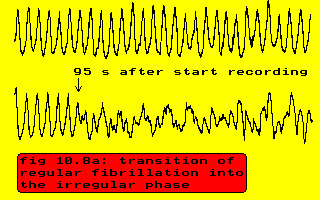
fig. 10.8: ventricular flutter and fibrillation after tachycardia
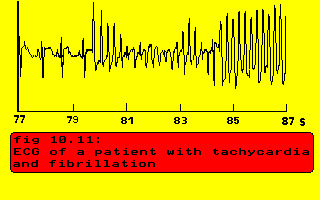
- J1: The second example consists of tachycardia and ventricular fibrillation in a 76 year old man with an old anterior-septal infarction.
3.4 Discussion and conclusion
No conclusions will be drawn with respect to correlation between clinical data and type or form of the power spectrum or with respect to reliability, because this is not a clinical investigation.
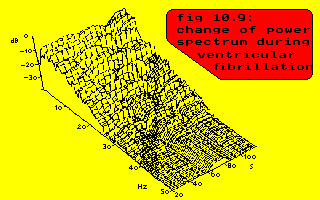
The frequency content of the ECG of patients during ventricular fibrillation has been investigated directly Agizim 1976 , Nygårds 1977 and Hulting 1979 and indirectly (by filtering) Kuo 1978 in order to design a reliable automated ECG monitoring system, that will detect ventricular fibrillation quickly without mistakes. The dynamics of the spectral characteristics of ventricular fibrillation in dogs during dying and resuscitation of the body have also been studied Tabak 1980 , Martín 1983 and Martín 1986 . The spectrum published by Agizim et al. (1976) looks like the spectrum of white noise, but the other authors show spectra, principally looking like the spectra in this study. Tabak et al. (1980) investigated the dynamics of the auto power spectrum during induced ventricular fibrillation in 46 dogs. They classified ventricular fibrillation into three stages:
- the spectrum contains 1 peak shifting from 12 Hz at the start to 9 Hz at the end of this stage;
- the spectrum shows two peaks, the one with the lower amplitude looks like a continuation of the peak of stage 1 and shifts in this stage from 9 to circa 7.5 Hz and the other shifts from approximately 4.5 to 3.5 Hz;
- just as in stage 1 the spectrum contains only 1 peak, but this peak can now be considered as a continuation of the low frequency peak of stage 2 and shifts from circa 3.5 Hz to almost zero.
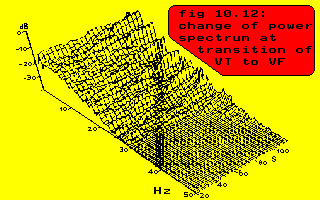
These stages are illustrated in the next figure.
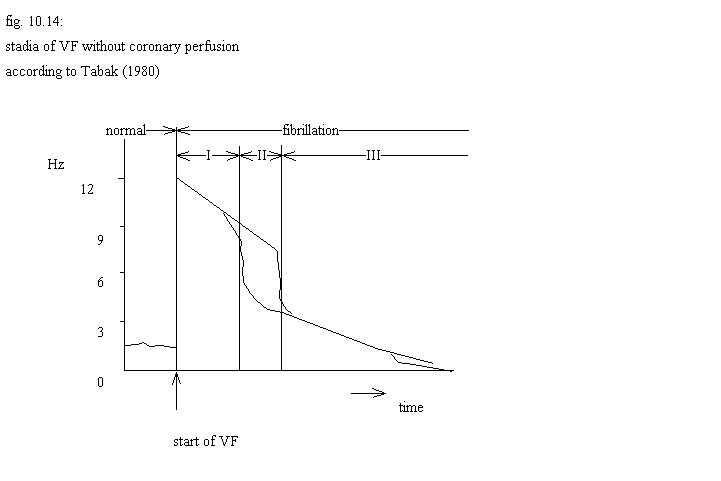
The results of Tabak resemble the results of this study in the number of stages, but not in all the characteristics of the stages. The fact that Tabak and co-workers did not find higher harmonics in the spectrum of the ECG at the start of ventricular fibrillation (stage 1) is a direct consequence of their sampling frequency of 50 Hz. As these higher harmonics disappear in the beginning of stage 1 fig. 10.7 , they never enter into their picture. Very interesting is Tabak’s suggestion that ventricular fibrillation in stage 2 is not a slowed down version of ventricular fibrillation in stage 1, but that the lowest frequency component is new. Expressed in terms of the model developed in chapter V, par. 4 this would imply that the two synchronized groups of cells are during stage 1 of equal size, but unequal in stage 2. Their figure 2 as redrawn in figure 10.14 seems a very idealized picture, based upon a Fourier transform of 25 Hz in 32 points, so whether really a linear decrease of fibrillation frequency is present (contrary to fig. 10.7 ) is doubtful.
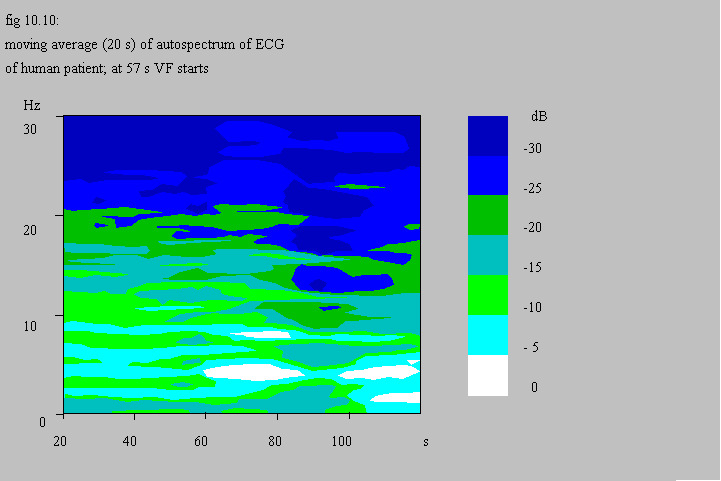
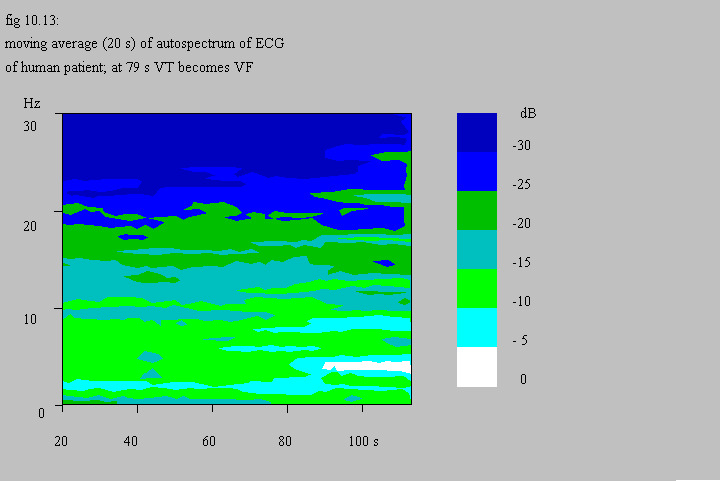
Martín and coworkers show the same type of spectra as presented in this work and they also indicate a non-linear decrease in fibrillation frequency during anoxia Martín 1986 . Apart from the evidence given in the previous chapters, fig. 10.10 and fig. 10.13 again strongly suggest that ventricular fibrillation can be considered as a tachycardia with myocardial cells organized in two groups in anti-phase. The results pictured in fig. 10.7 may also be reinterpreted as a slow decrease of the fibrillation frequency from 5.5 Hz to 4.5 Hz accompanied by the fundamental frequency becoming visible due to an increasing unequal distribution of cells over the anti-phase groups.
The time course of the power spectrum of the ECG seems a sensitive tool to detect ventricular fibrillation and to investigate different types of ventricular fibrillation. During ventricular fibrillation the heart of the patients appears to behave more steady than the heart of dogs.
4 Conclusions
Too few patients have been investigated for firmly based conclusions and the spectral dynamics of ventricular fibrillation in the two dogs were only studied to get a link between the results of the analysis of ventricular fibrillation during coronary perfusion and the results in patients. Nevertheless ventricular fibrillation in patients seems to fit the same model as ventricular fibrillation in dogs, which implies that the official WHO definition (“irregular disorganized electrical activity…”, WHO/ISFC Task Force (1978)) does not reflect intrinsic characteristics of ventricular fibrillation. Also the distinction between flutter and fibrillation seems more a distinction between stages of fibrillation than between different syndromes.
The difference between the “healthy” heart and the diseased heart will be discussed in chapter XII.