1 Introduction
In the course of this investigation several ideas and theories about the nature of ventricular fibrillation emerged, were tested by specific experiments and were rejected.
The first experiment to be described will show how a complete stop of the artificial coronary flow changes ventricular fibrillation into a kind of ventricular tachycardia, but restoration of the coronary flow after 2.5 minutes gave rise again of ventricular fibrillation, albeit different from the beginning.
The second experiment will show that ligation of the left anterior descending artery during ventricular fibrillation does not have any noticable effect, although this type of ligation in a beating heart will normally produce ventricular fibrillation.
In the third experiment the dog was perfused with a tricyclic antidepressant to see the effect on ventricular fibrillation, as already was known from unpublished observations that the drug used prevented the initiation of ventricular fibrillation by electric shocks.
The last experiment was designed to see whether synchronization of ventricular fibrillation to an external source of stimuli is possible. The synchronization failed, but the way ventricular fibrillation started gave support to the previously mentioned model of local fibrillation.
2 Complete stop of coronary flow
After the heart of a dog was brought to ventricular fibrillation in the usual way, the aorta was ligated just caudal of the main stem of the coronary arteries. As the heart was retrogradely perfused, the flow through the coronaries completely stopped. After 2.5 minutes the ligation was released and the coronary system was reperfused.

In fig. 11.1 the autospectra of one of the bipolar electrograms during these three stages has been drawn. Before the ligation the basic fibrillation frequency is 11 Hz. This channel not only gave rise to peaks at 21.5, 32.5 and 43 Hz, but also to very clear peaks at 5.5, 16 and 27 Hz. The spectra of all 13 simultaneous electrograms showed a fibrillation frequency of 11 Hz, but just a few showed the “subharmonic” of 5.5 Hz. In chapter VI arguments are given to consider the low frequency of 5.5 Hz as the true repetition frequency of the individual myocardial cells. A part of the signals belonging to the spectra of fig. 11.1 is shown in the next figures.
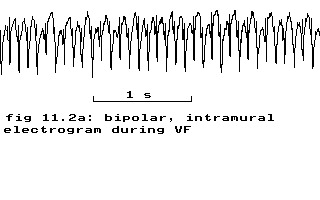

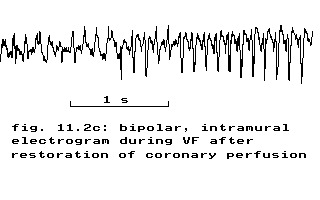
fig. 11.2: bipolar epicardial electrograms of a dog before, during and after stopping the coronary perfusion
During the ligation period the spectrum changed drastically. No clear repetition rate can be derived from the spectrum, as is also evidenced by the very irregular, strange electrical activity during the ligation period (fig. 11.2b). Restoration of the coronary flow after 2.5 minutes almost immediately gave rise again of ventricular fibrillation (fig. 11.2c) albeit with a lower repetition rate and more irregular than before the ligation (fig. 11.1). All 13 simultaneous bipolar recordings from two perpendicular intramural needles showed the same pattern.
If the deflections in fig. 11.2 can be interpreted as beats, the heart is beating at a frequency of 150 beats per minute or 2.5 Hz. The form of the recorded deflections could be caused by slow conduction and slow conduction will lead to ventricular tachycardia Cranefield 1975(p. 281) and the necessary degree of depression of excitability to achieve this type of conduction can result from e.g. anoxia. Maybe this experiment could be interpreted as an indication that ventricular fibrillation and ventricular tachycardia are caused by the same mechanism, as transitions from one state to the other and vice versa are possible. Some patient data in chapter X also point to such a possibility and in chapter XII a mathematical indication will be given.
3 Ligation of LAD
The nearly invariable sequel of fibrillation within 5 to 20 minutes after a one-stage ligation of a sufficiently large coronary artery Cranefield 1975(p. 306) led to the reverse experiment of ligation of the left anterior descending artery during ventricular fibrillation. The form of the autospectrum and the fibrillation frequency remained the same before, during and after a 5 minutes ligation period. Contrary to the anoxic condition of the whole heart as described in the previous paragraph, this ligation apparently favours conditions to start ventricular fibrillation in a normally beating heart, but does not affect fibrillation itself.
4 Imipramine
In the course of resuscitation research dr. A. N. E. Zimmerman made the chance observation that after an imipramine (a tricyclic antidepressant) intoxication ventricular fibrillation could not be induced. In order to see what the effect of imipramine would be on a fibrillating heart, the drug was administered to two dogs with fibrillating, perfused hearts at a rate of 5 mg/min. In the first 5 minutes no effect of imipramine was seen and the effect over a prolonged period has been tested in only one dog.
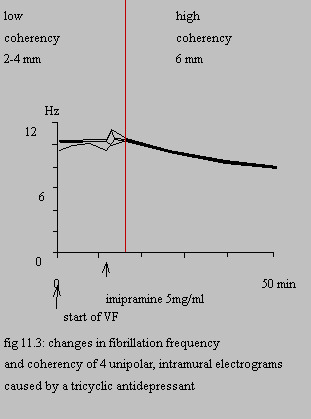
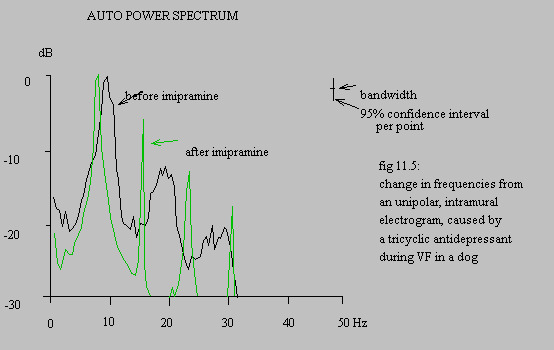
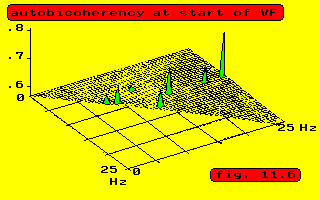
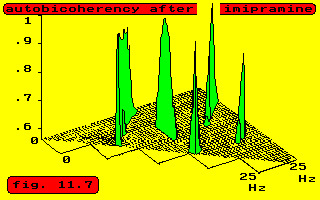
In fig. 11.3 the change in the fibrillation frequency measured at 4 unipolar intramural electrodes has been indicated. In the beginning different frequencies were present at the same time, even at one electrode and consequently the coherency between adjacent electrodes was low or absent. All electrodes became highly coherent after 4.2 minutes of infusion and showed the same peak frequency, although phase differences remained present and were rather erratic. At the start of the coherent period the phase difference between the electrodes at 6 mm distance was approximately half a repetition period. This difference diminished to practically zero at the end of the experiment. The other phase differences were lower and also vanished towards the end.
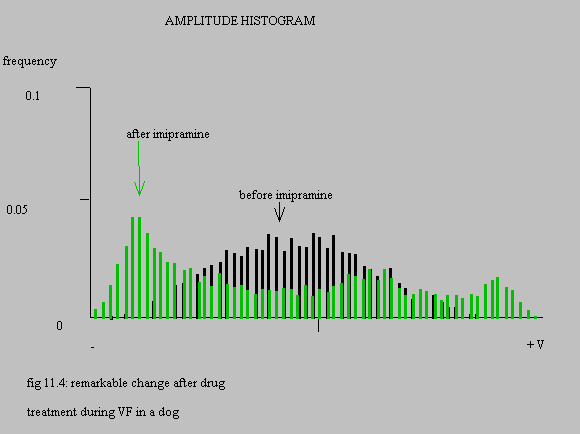
The results of the signal analysis along the lines sketched in chapter IV are shown in figures 11.4, 11.5, 11.6 and 11.7 for one electrode, comparing the situation at the start of ventricular fibrillation and the end of the experiment.
effect of imipramine on ventricular fibrillation
This experiment has been terminated by injecting 75 mg of imipramine into the aorta near the origin of the coronary arteries. The fibrillation at 8 Hz changed into flutter of circa 4 Hz. Another shot of 50 mg brought the heart into asystole, followed by some ventricular systoles and thereafter sinus rhythm. Induction of ventricular fibrillation was no longer possible. Contrary to the previous paragraph imipramine favours conditions that prevent the start of ventricular fibrillation, but cannot easily stop it, although it does influence the fibrillation frequency, possibly by prolonging the refractory period. In chapter XII an attempt will be made to give a mathematical explanation.
5 Synchronization
One of the theories tested was that during ventricular fibrillation the myocardial cells are not synchronized and some experiments were planned in order to try to synchronize the cells so that the fibrillation would end. In the mean time the theory emerged that the trouble of ventricular fibrillation is that the cells are synchronized, but in antiphase. Of the planned experiments only one has been performed, but in retrospection this gave valuable information about the start of ventricular fibrillation. The transition from stimulated tachycardia to fibrillation is shown in fig. 11.8 and fig. 11.9.

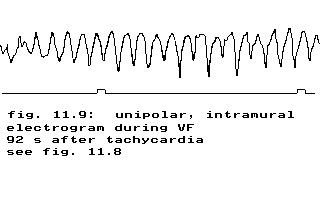
fig. 11.9: ventricular fibrillation 92 seconds after tachycardia
The heart had been stimulated with current pulses of 5 milliseconds duration at 20 ms intervals. The heart responded during 10 seconds with a rate of almost 500 b.p.m. – i.e. a repetition period of 120 ms – corresponding to a one to six block with respect to the stimuli. The fibrillation frequency is circa 13.5 Hz, corresponding to a repetition period of 74 ms. According to the arguments developed in the previous chapters the repetition period of the individual cells should be regarded as 148 ms. Comparing this period to the repetition period during stimulation of 120 ms, the conclusion would be that during ventricular fibrillation the individual myocardial cells run slower than their maximum speed. In chapter XII a mathematical model explanation will be given of this slowing down.
If one would accept the fibrillation frequency of 13.5 Hz as the repetition frequency of the cells, i.e. a repetition period of 74 ms as possible, than the 50 Hz stimulation would bring the heart to at least a beating rate of 750 b.p.m. (A period of 74 ms fits into 80 ms, corresponding to a one to four block. A repetition period of 80 ms means: 12.5 Hz, which equals 750 b.p.m.)