1 Dispersion of refractory period
The intrinsic frequency of the relaxation oscillators as constructed in chapter VIII depends upon the type and number of connections between cells and upon the length of the refractory period. Han and Moe ( Han 1964 ) reported a dispersion in the recovery of excitability in ventricular muscle of 2-4 msec per mm in normal beats; premature beats, stimulation of sympathetic nerves, myocardial ischemia and other interventions increased the dispersion. In this publication the dispersion was measured over distances up to 4 mm. Later Han et al ( Han 1966 ) measured the ventricular refractory period over the whole ventricle and found a dispersion of 20 msec at a heart rate of 300 beats/min, or 10% of the interval length. Burgess et al ( Burgess 1972 ) reported functional refractory periods ( Hoffman 1960 ) of 149 – 160 msec at the basis and of 154 – 174 msec at the apex of the ventricle. Moreover they stated that the endocard always has a higher functional refractory period than the epicard. These figures are in accordance with the 5 – 10 msec difference in duration of the action potential between epicard and endocard and between basis and apex as published by Kootsey and Johnson (Kootsey 1976 ). Amlie saw at a mean effective refractory period in the ventricle of 145 msec a dispersion in the same order of magnitude ( Amlie 1978 ). At a mean repetition frequency during ventricular fibrillation of 6 Hz this dispersion of approximately 10% would cause a range of intrinsic frequencies of 5.5 – 6.7 Hz and for reasons explained in chapter VI, par. 4 to a range of 11 – 13 Hz in the apparent fibrillation frequency. This variation is typically the variation found in the basic frequency of electrograms from different parts of the normal, healthy fibrillating dog heart.
2 Relaxation oscillators
The findings of chapter VII, par. 5 are strongly reminiscent of weakly, resistively coupled relaxation oscillators. The theoretical work of Linkens (Linkens 1979a , Linkens 1979b , Linkens 1979c , Linkens 1979d and Linkens 1979e ) about these oscillators also indicates that the anti-phase mode is possible but unstable. As mentioned in chapter VIII, par. 3 , coupling of relaxation oscillators with different intrinsic frequencies can lead to partial entrainment of frequencies, i.e. the range of frequencies diminishes, but a frequency gradient remains.
3 Pseudowaves
If a group of oscillators, coupled or uncoupled, is running at slightly different frequencies and their phases are only observed as an on/off phenomenon (a light bulb going on and off, a muscle cell contracting and relaxing), travelling waves are seen. These waves are called pseudowaves by Winfree 1980 , as they depend upon an optical illusion, not upon the transmission of physical or chemical energy. These illusions are shown in pseudwav in VFMODEL . The conflicting results of chapter VII, par. 4 are much easier understood as this type of illusions, than as real, travelling waves. The controversies between different theories about ventricular fibrillation can be viewed in this light, as different ways of data collection plus different (sometimes implicit) assumptions will lead to different explanations of the same phenomenon. Wiggers made movies of the surface of fibrillating dog hearts and saw how large, slowly moving contraction waves progressively dissolved into smaller and quicker waves ( Wiggers 1930 and Wiggers 1940 ). Epicardial potentials at the onset of ventricular fibrillation have been measured – assuming conduction of action potentials and enough local coordination to determine an activation time – and the progression of the activation front during ventricular fibrillation has been studied, see: Smith 1978 , Harumi 1979 , Ideker 1980 and Ideker 1981 .
The best illustrations are found in Ideker (1981) and his figures 5F and 6H are redrawn and combined in the next figure.
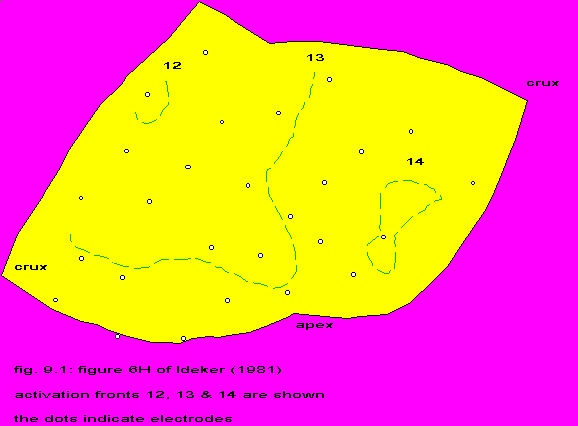
activation fronts 12, 13 & 14 are shown
the circles indicate electrodes
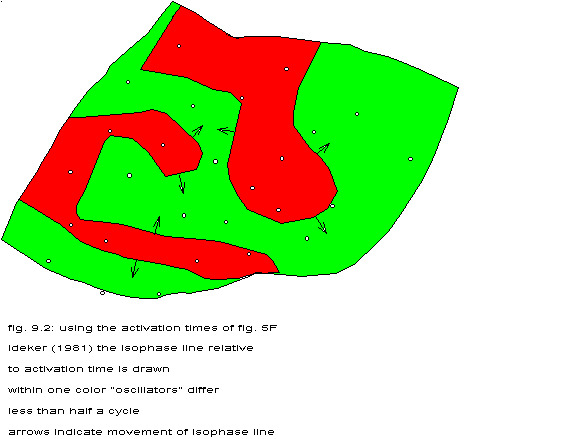
the isophase line relative to activation time is drawn
within one color “oscillators” differ less than half a cycle
arrows indicate movement of isophase line
Not only travel their activation fronts with a locally varying speed, but also are at the same time three subsequent fronts present on the surface of the ventricle. If an observer unfamiliar with the history of these fronts would look at the surface of the ventricle at the moment of fig. 9.1 like Wiggers did, he would see however quite a different picture (fig. 9.2), with “waves” travelling in the opposite direction of Ideker, just as the difference between “blocks” and “numbers” in pseudwav in VFMODEL .
4 A computer model
To illustrate the illusion of travelling wavefronts more realistically, a simulation program has been made, that combines the oscillators mentioned in chapter VIII on a heart-like surface. The intrinsic frequency of the oscillator at the apex is 11.6 Hz and of the oscillators at the basis 12.7 Hz. The amount of coupling is variable. The phase difference at the start of “fibrillation” is (partially) based upon data on the total excitation of the isolated human heart (Durrer 1970 and Scher 1979 ). The reader is invitated to experiment with VFMODEL .
5 Conclusion
Modelling the electrical behaviour of the fibrillating heart at the level of external electrodes as weakly, resistive coupled relaxation oscillators with frequency gradients of circa 10% over the whole ventricle, not only explains the results found in chapter VII, but also reunites controversial ideas about ventricular fibrillation as different ways of looking at pseudowaves, caused by the partial entrainment of relaxation oscillators.